
In Konsumentkompassen, I visualized data by creating bar and pie charts, as well as working on page layout and image editing.

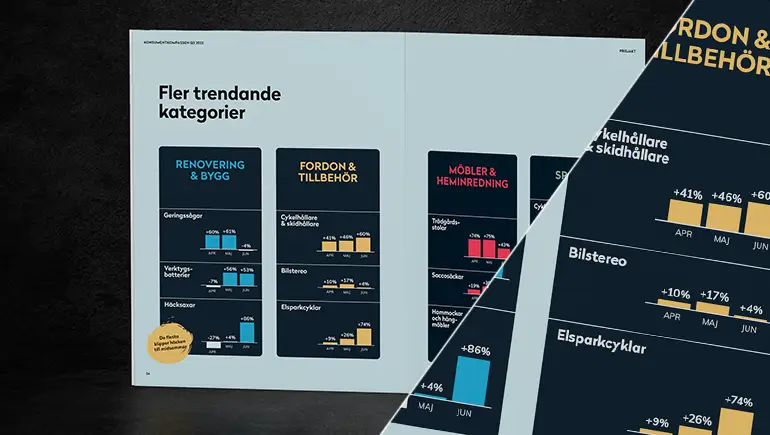
This section, titled 'Trending Categories', presents graphs I created for trend analysis of various product categories for the upcoming period.
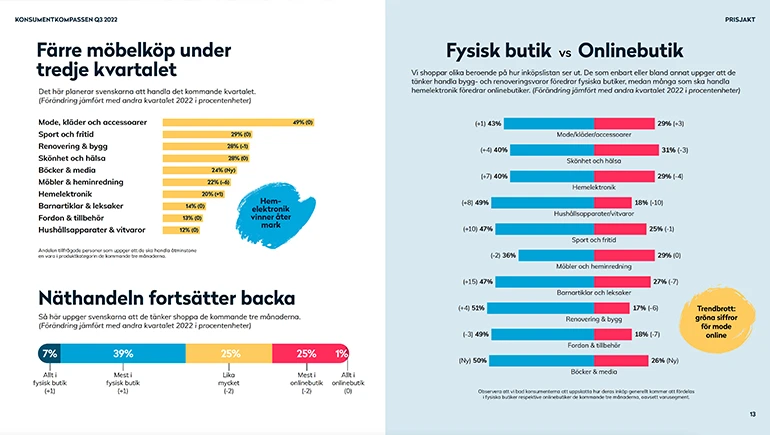
Here are examples of different types of horizontal bar charts I created for Konsumentkompassen.
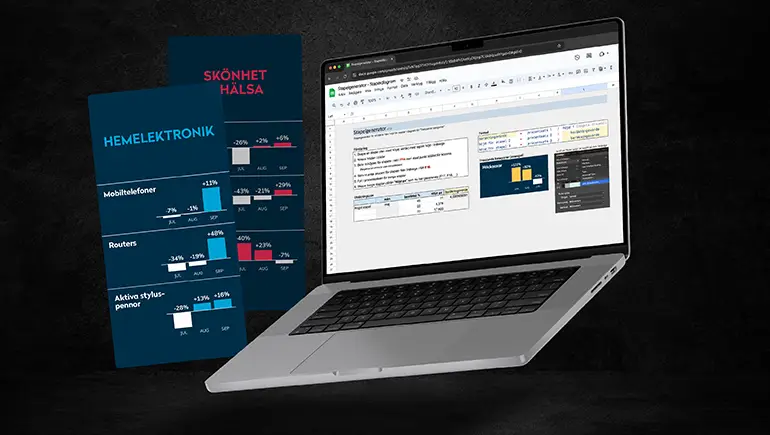
I also developed a tool to streamline and simplify the creation of individual bars in the various bar charts within the 'Trending Categories' section.
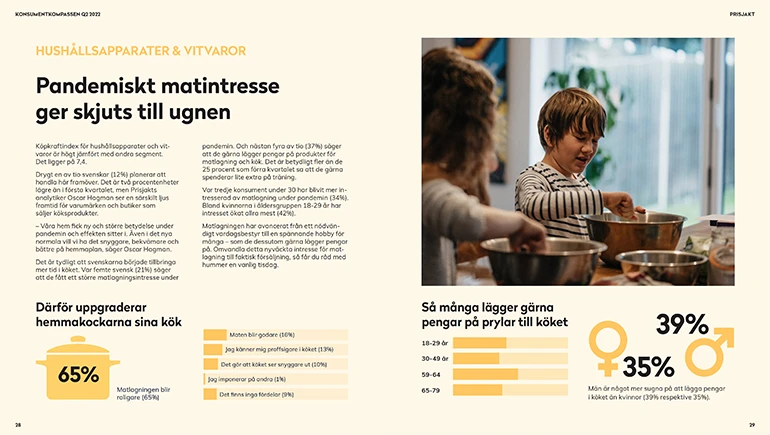
An example of the page layout I created for one of the Konsumentkompassen reports.